
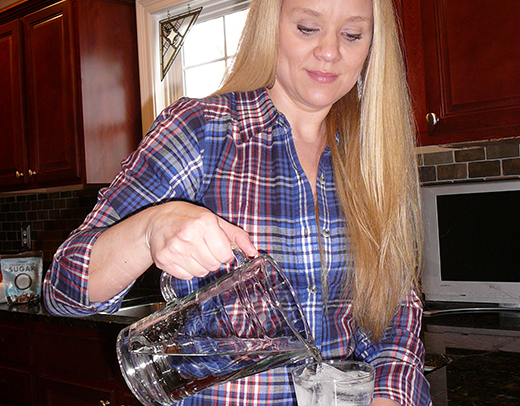
Teresa Kaiser started filtering her water after noticing it smelled of chlorine. Since then, she started learning more alarming information about her tap water. (Photo by Andrea Roth)
BY ANDREA ROTH
East Peoria resident Teresa Kaiser changed how she thought about water eight years ago.
“We came home after a few days away, and I opened the freezer and an overwhelming swimming pool smell hit me,” Kaiser said. “Why would I want to ingest that?”
I meet frequently with people concerned about their tap water. We call ourselves the Central Illinois Water Warriors. Some public water consumers I talk with worry about regularly drinking chlorine because it tastes terrible and causes skin, eye and respiratory irritations at higher levels.
Introduced in the early 1900s, chlorine disinfectants remove microbial pathogens that cause illness. Of the water treatment methods available now, almost 120 years later, chemical disinfection remains a popular, lower cost option for aging water infrastructures. Chemically disinfected tap water is typically free of microbes. However, the disinfectants (such as chlorine, ozone and ammonia) react with decaying vegetation and urban and agricultural chemicals to create disinfection byproducts (DBPs). If public utilities don’t add ammonia, it can be present in raw water supplies due to erosion and residential and agricultural practices. In water systems with ammonia and chlorine (called chloramine), the ammonia oxidizes, and a microbial process called nitrification occurs. When nitrates are ingested they become nitrosamines, carcinogenic even at low levels.
In 1976, the National Cancer Institute presented data that chloroform, another chlorination byproduct, caused cancer in rodents. In 2002, an Environmental Working Group (EWG) review of DBP health effects found nearly 30 peer-reviewed epidemiologic studies linking DBPs to increased risks of bladder, rectal and colon cancers, kidney and spleen disorders, immune system problems, neuro-toxic effects, miscarriages and reduced birth weight.
In 2008, the EWG conducted a bottled water lab study and found bottled water levels of DBPs also exceeded health standards. According to the U.S. medical group Physicians for Social Responsibility, there is “now evidence that disinfection, though pivotal in fighting infectious disease, may also result in cancer and other health risks.”
DBPs can be absorbed through the skin and inhaled. Physicians for Social Responsibility notes that swimming, showering and bathing in chemically disinfected water “increases the levels of DBPs in the bloodstream.” And yet, the U.S. Environmental Protection Agency (EPA), through its Integrated Risk Information System (IRIS), has not fully assessed the carcinogenic risk of DBP inhalation exposure.
More than 600 different DBPs can form in chlorinated tap water, including 74 DBPs which are associated with DNA damage, toxicity and carcinogenicity. But only 11 DBPs are regulated by the EPA. One regulated group of DBPs, total trihalomethanes (TTHMs), includes chloroform. The second regulated DBP group, Haloacetic acids (HAA5s), wasn’t under EPA regulation prior to 2002.
The type of DBPs and how many are formed depends on the raw water contaminants, temperature, weather and amount of organic matter present, such as leaves and bark tannins. Biofilm, an algae-like bacterial slime found in water systems, also affects DBP creation. The longer chlorine reacts with vegetation, the more DBPs are created. To meet EPA chlorine requirements, water utilities may adjust chlorine and/or ammonia levels. However, ammonia feeds already established biofilm, and the biofilm consumes chlorine residuals, leading to more chlorine usage. This creates an unpleasant chemical treadmill for water utilities and consumers. To control for biofilm and nitrification, many area water utilities conduct multiple annual chemical burns, which can take a month or more to complete. Highly concentrated free chlorine is forced into water pipes to “burn off” biofilm. During the process, many consumers receive potent chlorine and brown tap water which contains DBPs and pipe sludge.
“At restaurants when water tastes and smells bad, I know they’re not using filtered water. So I’m putting junk in my body if I drink it,” Kaiser said. “And all the expensive coffee shops, do they use reverse osmosis filtered water? To use water that isn’t filtered is weird to me.”
While the EPA notes, “drinking water containing these byproducts in excess of the Maximum Contaminant Level (MCL) may lead to adverse health effects, liver or kidney problems, or nervous system effects, and may lead to an increased risk of getting cancer,” the EPA has not set health goals, called maximum contaminant level goals (MCLG), for all regulated DBPs. A MCLG is the level of a contaminant in drinking water below which there is no known or expected risk to health. For example, lead has a MCLG of zero because there is no safe level of lead.
Three of the TTHMs, trihalomethane, bromodichloromethane and bromoform each have a MCLG of zero. Chloroform has a MCLG of 4 ppb. One HAA5, dichloracetic acid, has a zero MCLG while the MCLG for two others are higher, trichloroacetic acid, at 20 ppb, and monochloroacetic acid at 70 ppb. The EPA has not set MCLGs for two other HAA5s, bromaecetic acid and dibromoacetic acid. EWG data shows that in my town of Morton, dichloroacetic acid was at 14.9 ppb in 2015, which exceeded the state average of 6.78 ppb. EPA studies show dichloracetic acid is carcinogenic, especially for the liver and reproductive and nervous systems. EWG data shows Peoria’s water contained 34.4 ppb of TTHMs, well above the Illinois average at 26.7 ppb. The U.S. TTHMs average was 23.2 ppb. East Peoria had chloroform at 12.7 ppb. A 2015 Natural Resources Defense Council report found Illinois in the top five worst states for health violations among large populations served by water systems.
“When I started looking into it, I realized I can’t trust the public utility to give me the cleanest water, because it isn’t cheap. So I have to take that upon myself to filter it,” Kaiser said. “We drink a lot of water, and I don’t want to put toxins in our bodies.”
Kim Biggs, a spokesperson for the Illinois EPA, said consumers can look up their water system’s individual DBP sample sites on the IEPA website and calculate the averages. But for consumers like Kaiser, the expectation to know what data to search for and make calculations is unreasonable, since the site uses contaminant terms unknown to the average consumer and this process is time-consuming.
“It seems like they are making it as complicated as possible to look this information up,” Kaiser said.
“The IEPA and utilities must provide what is required by law. But public utilities can provide what their constituents want (on the Consumer Confidence Report),” Biggs said. “Much of our actions are complaint driven, the IEPA cannot be in every community watching every source. We do rely on our citizens, they are the best advocate to provide information to our agency.”
This presents a conundrum. Current CCRs don’t explain health exceedance risks or provide detailed data on drinking water, so are consumers actually in a position to know they should speak up? I spoke at a public meeting in June 2017, with the IEPA present, and requested more data be provided on my CCR and on my town’s website regarding individual DBP averages. I will continue to speak up because it’s important this information is easily accessible.