

WILLIAM RAU
No. Just as it was impossible to stitch together an economy with half-slave, half-free labor, a half-nuke and half-renewable energy house is equally impossible. Nuclear and renewable power are irreconcilably incompatible. Yet, the General Assembly and Governor’s 2021 Clean Energy Jobs Act (CEJA) will attempt to build our future energy house with the two. Wear a hard hat and watch out for falling debris.
Renewable power, especially solar power, is highly variable with large swings up and down in energy output. To keep the lights on, solar must be combined with enough dispatchable power to “ramp up” when the sun goes down and then “ramp down” when the sun comes up. Gas peaker plants are designed for these fast ramps. And batteries are much better than gas peakers.
Nuclear power is the least dispatchable energy source. Nuclear reactors can be designed to ramp rapidly — reactors on nuclear attack subs, for example — but U.S. commercial power reactors were built to run steadily and always on. Commercial reactors are given 12 hours to ramp from a cold start to full power, and operators then want to keep it close to this level. In contrast it takes 5 minutes or less for cold-start gas peakers to reach full power, and less than a second for batteries to do the same. Commercial nukes can run with some dispatchability but at added operating and maintenance costs as well as greater risk of operating errors. Increasing nuclear risk is unacceptable, and Exelon is not receiving $3 billion in subsidies because their plants are nimble efficiency champs that can absorb added cost. Significantly increased dispatchability is not part of the nuclear game plan.
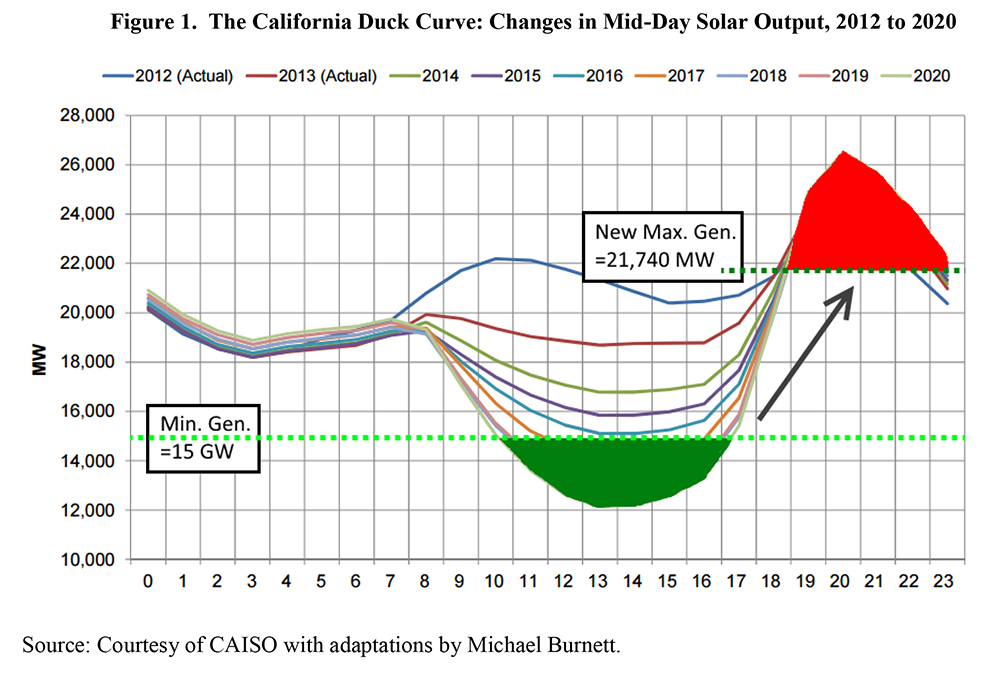
However, rapid dispatchability is exactly what the solar “duck curve” in Figure 1 requires. Developed by Brad Bouillon, from California’s Independent System Operator (CAISO), the figure charted California’s anticipated growth in solar output from 2012 to 2020. CAISO showed that the net load on the grid — the amount of electricity delivered by fossil and nuclear power plants — would drop from roughly 21,000 to 12,000 megawatts. Because of the huge drop in midday net load 2012 to 2020, the net load shape looks like a fat duck, its distended belly in 2020 the result of 10,000 megawatts of solar energy replacing fossil-nuclear energy.
That could not happen because California had 15,000 megawatts of non-dispatchable power that could not be shut off. CAISO would be forced to curtail at least 3,000 megawatts of solar output to prevent major reliability problems. (The green portion of the duck curve represents the megawatt hours of curtailed solar power.) Next, there would be a huge 10,000+ megawatt ramp, 5 to 8 p.m., when the sun was setting and people were guzzling energy at home. What might have happened in California by 2020 will happen before 2030 in Illinois under CEJA.
Solar was designed to follow fast-flying ducks, not waddle behind lumbering nuclear turtles. Even so, Illinois politicians have chained solar to a sclerotic tortoise. It won’t work. Next month we’ll turn to unchaining renewable energy by teaching the Illinois duck how to fly.
References
Burnett, Michael. 2016 (Jun 1). Energy Storage and the California Duck Curve. Stanford University; http://large.stanford.edu/courses/2015/ph240/burnett2/
CAISO. 2013. What the duck curve tells us about managing a green grid. California ISO; https://www.slideshare.net/PowerSystemOperation/what-the-duck-curve-tells-us-about-managing-a-green-grid-238326358
Lazar, Jim. 2016 (Feb). Teaching the “Duck” to Fly. Second Edition. Regulatory Assistance Project; http://www.raponline.org/wp-content/uploads/2016/05/rap-lazar-teachingtheduck2-2016-feb-2.pdf