
There are probably several factors that lead to lower voter turnout in some elections. Obstacles to Getting Out The Vote range from apathy and poverty to a lack of transportation (especially in rural areas or communities without public transportation), dissatisfaction with choices and limited exposure to engagement — particularly in “off-year” elections with no presidential contest and consolidated local elections.

In those, such as the election this April 1 in Illinois, political parties, candidates and news media spend less time and money on effective communications to the public.
The United States is behind many other countries in voter turnout, so even when turnout improves — like in 2020 and 2024, according to the Pew Research Center — the USA is in the middle of the pack.
At the top of the 51 members of the Organization for Economic Cooperation (OECD), Pew listed the turnout rate for six nations (Uruguay, Turkey, Peru, Indonesia, Argentina and Sweden) as better than 80%.
At the bottom of the OECD list are Costa Rica, Croatia, Luxembourg, South Africa, Bulgaria and Switzerland, all with about 52% or less.
The United States sits at No. 32 with a 62.8%.
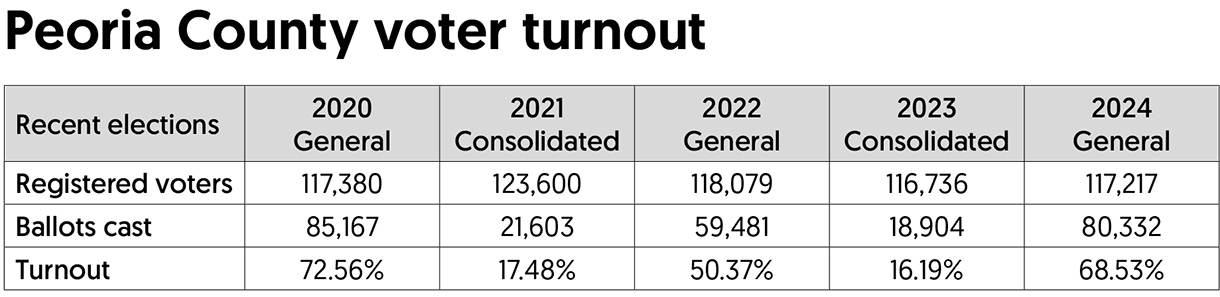
There is a slight difference between what’s a turnout — the percentage of those who registered (and therefore at some point intended to vote), and the percentage of those of the voting age of 18 (and presumably could vote). So, in Peoria County since 2020, turnouts of the percentage of registered voters who cast ballots fluctuated between 16.19% to 72.56%. (See chart.)
The Consolidated General Elections of 2021 and 2023, like this April’s contest, averaged 16.8, compared to the general elections of 2020, 2022 and 2024 averaging 63.82.
However, the most recent Census estimate of the population in Peoria County is 177,163, with 42,248 residents younger than 18 years old. Therefore, about 135,265 are age-eligible to vote, and since the Peoria Election Commission reports 117,217 registered voters, more than 18,000 Peoria County adults are not even registered.
The Watch: Primary preventing early voting; check out ElectionStats
In November, about two-thirds of voting-age citizens cast ballots, meaning tens of millions did not. Donald Trump defeated Kamala Harris 77,302,580 to 75,017,613 (49.8% to 48.3%), according to the Federal Election Commission, reporting the total as 152,320,193 — 98.1% of all votes for president.
Meanwhile, the nonpartisan independent election organization Ballotpedia reported that another 2,895,872 votes went to 22 other candidates with at least 359 votes — such as Jill Stein (Green Party), RFK Jr. (independent), Chase Oliver (Libertarian), and Cornel West (independent) — and write-ins nationwide.
Americans who could vote but didn’t may be a significant political group.
“The 2016 election also highlighted the political impact of non-voting,” writes columnist and cartoonist Ted Rall. “Non-voters skewed Democratic [according to Pew Research], accounting for 55% as opposed to 41% for Republicans. Hillary Clinton lost because she wasn’t able to motivate enough of her own party’s supporters.
“Non-voters were even more powerful in 2024,” Rall adds. “An astonishing 19 million Americans who voted for Joe Biden in 2020 considered the choice between Kamala Harris and Donald Trump and picked the couch.”
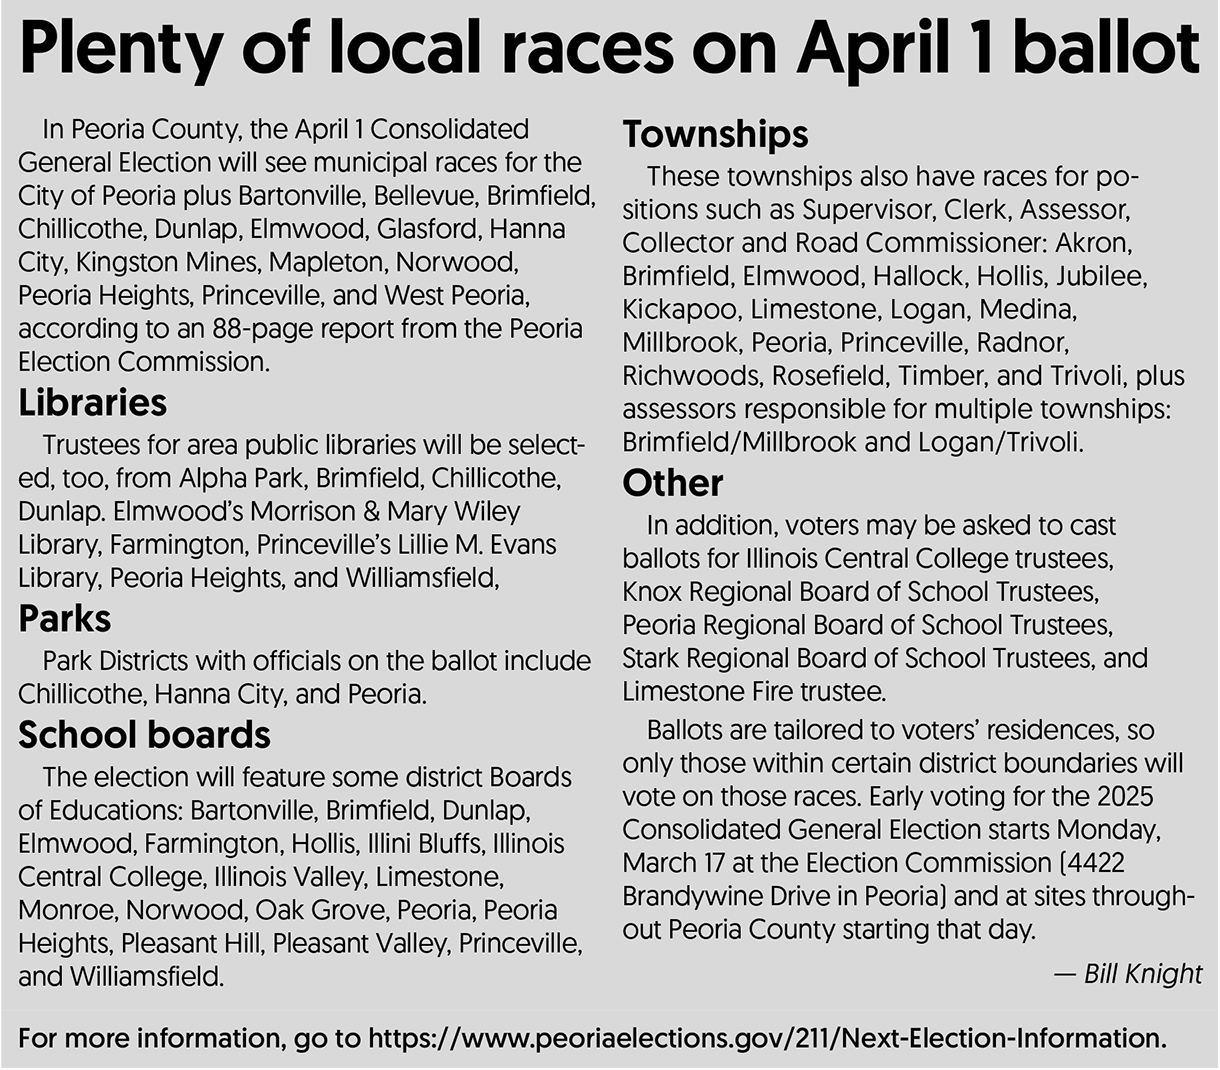
Locally, the turnout for the April 1 consolidated election is expected to follow the historical pattern.
That’s troubling to the League of Women Voters of Greater Peoria, which recently posted, “These elections will determine the future of the City. People elected will make decisions on how our tax money is spent.
“Want to see your City do more of this and less of that? Spend more tax money here and less tax money over there? You have to vote and make your voice heard!”
Recent Comments