WILLIAM RAU
My last column finds the Illinois Emergency Management Agency whitewashing heatwave risk by aggregating a misleading measure into just one score for a county. Thus, Cook County’s 136 diverse municipalities, and strikingly diverse 1,332 census tracts, are all labeled as “high risk.” Heat-trap apartments in treeless, asphalt-covered Chicago heat islands, therefore, carry the same risk category as forested Winnetka mansions.
End result: heatwave-vulnerable areas are buried under an overly aggregated, meaningless risk designation.
It’s no different in McLean County’s draft Hazard Mitigation Plan. McLean County’s EMA declares as “low risk” each of its 47 census tracts. Strange: City Builder, Citi Bank’s free database for investment professionals and urban planners, lists the heat risk for all 32 census tracts in Bloomington-Normal as “very high.” Moreover, some are riskier than others due to very little tree cover. Adding in human vulnerability measures further and substantially increases risk for disadvantaged census tracts.
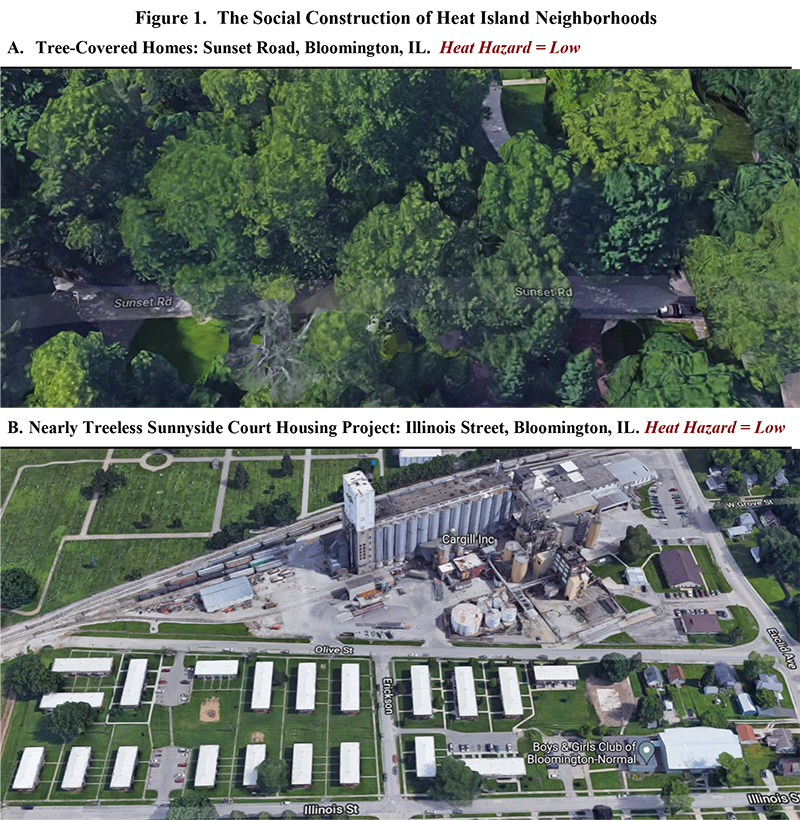
Why the huge heat risk differences? City Builder uses 27 climate change models to predict future heat trends, downscales trends to 1.2-square-mile grids, and maps them onto census tracts. In contrast, IEMA and McLean EMA massage decades-old county weather data knowing full well that outdated, county-level measures wash out major differences in risk found across census tracts. One result: The essentially treeless Sunnyside Housing Project, with apartments lacking central air, carries the same “low” heat rating as air-conditioned homes along Bloomington’s Sunset Road. Completely covered by trees, Sunset homes run along Bloomington’s Hedge Apple Woods. In sum: As practitioners of voodoo statistics, Illinois emergency managers assign less heat risk to Sunnyside residents (“low”) than inhabitants of tree-covered mansions adjacent to Lake Michigan (“high”).
Since Bloomington is officially designated as “low” risk, city administrators chose Bloomington Public Library as the only cooling center for its 78,000 inhabitants. Problem No. 1: If all residents lacking air conditioning tried to shelter at BPL, it would run out of space. Problem No. 2: Blacks in Bloomington earn only 45% of the income of Whites ($29,800 versus $66,600); so, lack of air conditioning will be disproportionately concentrated in Black households. Problem No. 3: BPL has no backup electricity. A heatwave taking down the grid will also take out the cooling center. Problem No. 4: BPL has 1-to-5 Sunday hours; heatwaves don’t keep business hours. People arriving overheated at 1 p.m. will be displaced onto furnace-hot streets at 5 p.m.. During the 2019 polar vortex, homeless people were forced to leave BPL at closing hours. It was minus-20 degrees below zero outside. Will the library also evict people into life-threatening heat?
And will the evicted be mostly Black residents? Are voodoo statistics racist? Early in the 20th century, the federal government drew red lines around Black neighborhoods and then denied federal backing to mortgages for redlined properties. Banks followed suit and denied credit of any sort. Starved of capital, once vibrant neighborhoods degenerated into ghettos with many substandard, heat-trap apartments. Many who occupied such apartments died during Chicago’s 1995 heatwave. Now, early in the 21st century, IEMA (with FEMA’s approval) omits the same redlined neighborhoods from hazard mitigation maps thereby depriving their residents of disaster mitigation planning and related benefits.
Never was whitewashing more appropriately color coded.
References
Charles, J. Brian, et al. 2019 (Jan 14) Segregation in the Heartland. Governing; https://www.governing.com/archive/gov-segregation-series.html
Citi. 2022. City Builder: Where Private Capital Meets Public Growth. Citi Ventures Inc.; https://www.citivelocity.com/citybuilder/eppublic/cb/us/
McLean County EMA. 2022 (Feb). McLean County Multi‐Jurisdictional All Hazards Mitigation Plan (Draft); https://mcleancountyil.gov/85/Emergency-Management-Agency
Schagen, Ian. 2008 (May 1). A Simple Guide to Voodoo Statistics. Education Journal; https://www.nfer.ac.uk/publications/55501/55501.pdf


Recent Comments