

WILLIAM RAU
Deadly heat gets no respect. Natural hazards that count — tornadoes, floods, etc. — are property-destroying traumas. Homeowners, public infrastructure, and insurance companies all take big hits. The Great Flood of 1993, for example, destroyed 24,000 Illinois homes and 884,000 acres of crops. In contrast, heatwaves are quiet, sneaky people killers. Heatwaves, like neutron bombs, leave rent-generating buildings standing; the people inside are felled.
Thus, the Great Flood of 1993, which killed fewer than a dozen Illinoisans, is memorialized by former Gov. Bruce Rauner in the 2018 Illinois Natural Hazard Mitigation Plan (IEMA). However, Chicago’s 1995 Heatwave, which killed 740, did not merit “Greatness” in 2018 nor classification as a federal (FEMA) disaster in 1995. FEMA does not list heatwaves among the 19 disaster ‘incident types’ for governors to cite in federal disaster petitions; nor does FEMA require a dead body count in its spreadsheet for a petition’s estimate of property damages.
Heat deaths receive further trivialization through severe undercounts in medical death records. Since heat works through five physiological mechanisms (ischemia, cytotoxicity, inflammation, coagulation, and rhabdomyolysis) to destroy one or more of seven bodily organs, there are 27 different ways for heat to kill (Mora 2017). Yet, it is most often one of the 27 effects of heatstroke — a heart attack, renal failure, etc. — that’s listed on death certificates. Heatstroke gets left out.
California’s 2010-2019 medical records listed 599 heat deaths. When the LA Times turned to epidemiology for estimating heat deaths, the count totaled 3,900: 6½ times higher than the official count. This is not a California anomaly. Kate Weinberger found a greater undercount for 297 large counties containing 174 million people. Whereas the Center for Disease Control counted 658 yearly deaths from records for the entire nation, Weinberger’s epidemiological estimates yield 5,600 heat deaths per year (1997-2006) for 62% of the US population: thus, much more than 8½ times higher than CDC’s count.
Rauner’s 2018 Plan adds novelty to undercounting. It begins prosaically by radically discounting heatwave risk (“Historical evidence points toward a higher risk of heat in the early part of the 20th century … .” IEMA, VII-55). The novelty is to avoid data identifying high-risk hot spots in Peoria, East St. Louis, Chicago, and elsewhere. Hot spots are revealed with fine-grained, census tract heat-vulnerability measures for percentages of seniors, minorities, diabetics, amount of green space, households without air conditioners, and so forth. High scores on such measures increase risk and indexes combining them existed well before Rauner’s 2018 Plan (Reid 2009). One example is Wisconsin’s 22-measure, heat-vulnerability index for census tracts. It creates the map (Figure 1b) that guides this state’s mitigation efforts (WDHS 2014).
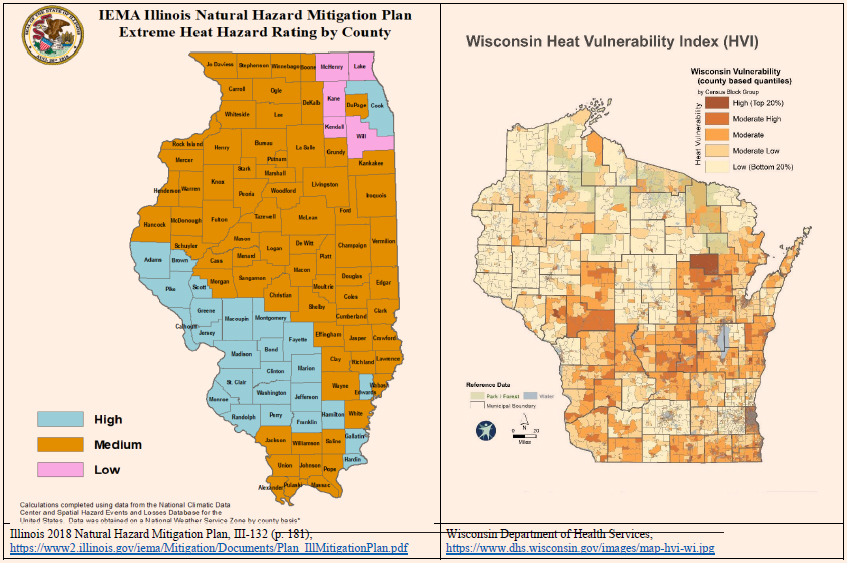
In contrast, IEMA’s cartoonish “heat hazard” map (Figure 1a) looks like the product of a botched high school science experiment. IEMA chose not to examine heat vulnerability thereby aborting the need for mitigation planning. IEMA concealed risks first by choosing an undefined measure of air temperature (the “heat hazard” rating) rather than a suite of empirically validated, human-vulnerability measures, such as used by Wisconsin.
Second, it engaged in research misconduct by aggregating its fuzzy mismeasure to the county level, a move which assigns an identical “heat hazard” rating to each of the 136, highly-differentiated Cook County municipalities. Therefore, a forested, Lake Michigan-hugging, Winnetka mansion with backup electricity generation receives the same “heat hazard rating” as a treeless, asphalt-roofed, AC-free tenement in one of Chicago’s west-side concrete jungles.
This deliberate, deceptive, and dangerous aggregation is scientific malpractice. If a research sociologist engaged in such data distortion, s/he could face disciplinary proceedings before the American Sociological Association’s Committee on Professional Ethics.
Thanks FEMA and IEMA. Like the Murder City Machine Guns, you’re quite the tag team.
References
FEMA 2022 (Jan 4). How a Disaster Gets Declared. Federal Emergency Management Agency; https://www.fema.gov/disaster/how-declared
Mora, Camillo, et al. 2017. Twenty-Seven Ways a Heat Wave Can Kill You: Deadly Heat in the Era of Climate Change. American Heart Association; https://www.ahajournals.org/doi/10.1161/CIRCOUTCOMES.117.004233
Philips Anna M., et al. 2021 (Oct 7). Extreme heat is one of the deadliest consequences of climate change. But California undercounts the human toll. Los Angeles Times; https://www.latimes.com/projects/california-extreme-heat-deaths-show-climate-change-risks/
Rauner, Bruce. 2018. 2018 Illinois Natural Hazard Mitigation Plan. Illinois Emergency Management Agency; https://www2.illinois.gov/iema/Recovery/Documents/Plan_IllMitigationPlan.pdf
Reid, Colleen E. 2009 (Jun 10). Mapping Community Determinants of Heat Vulnerability. Environmental Health Perspectives; https://www.ncbi.nlm.nih.gov/pmc/articles/PMC2801183/
WDHS. 2014. Wisconsin Heat Vulnerability Index. Wisconsin Department of Health Services; https://www.dhs.wisconsin.gov/publications/p0/p00882.pdf
Weinberger, Kate R., et al. 2020 (Apr 23). Estimating the number of excess deaths attributable to heat in 297 United States counties. Environmental Epidemiology; https://pubmed.ncbi.nlm.nih.gov/32613153/
2 comments for “Heat Waves — In Red and Black | Illinois unprepared for killer heat”